Исходный файл (SVG-файл, номинально 2936 × 3075 пкс, размер файла: 37 КБ)

Краткое описание

Описание
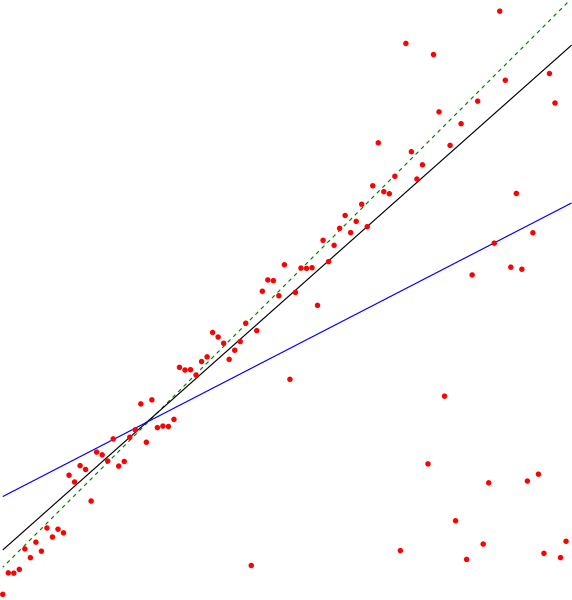
English: The en:Theil–Sen estimator (black line) of a set of sample points, compared to the simple linear regression line (blue). The points were generated by adding a small amount of jitter to points on the green dashed line and then replacing some of the points by random outliers.
Дата
Источник Собственная работа
Автор David Eppstein


Лицензирование

Я, владелец авторских прав на это произведение, добровольно публикую его на условиях следующей лицензии:
Creative Commons CC-Zero Этот файл доступен на условиях Creative Commons CC0 1.0 Универсальной передачи в общественное достояние (Universal Public Domain Dedication).
Лица, связанные с работой над этим произведением, решили передать данное произведение в общественное достояние, отказавшись от всех прав на произведение по всему миру в рамках закона об авторских правах (а также связанных и смежных прав), в той степени, которую допускает закон. Вы можете копировать, изменять, распространять, исполнять данное произведение в любых целях, в том числе в коммерческих, без получения на это разрешения автора.

Source code

This image was created as a pdf file by the following Python code, then converted to SVG.

from pyx import canvas,path,color
from random import random,seed
seed(12345)

N = 103
noise = 10
slope = 1.0

def sample(x):
    y = x * slope
    if random() < (y/N)**3:
        y = random()*N      # outlier
    else:
        y += (random()-0.5)*noise # non-outlier, jitter
    return y

samples = [(i*1.0,sample(i)) for i in range(N)]

c = canvas.canvas()

for x,y in samples:
    c.fill(path.circle(x,y,0.5),[color.rgb.red])

def theilsen(samples):
    N = len(samples)
    def slope(i,j):
        xi,yi = samples[i]
        xj,yj = samples[j]
        return (yi-yj)/(xi-xj)
    
    def median(L):
        L.sort()
        if len(L) & 1:
            return L[len(L)//2]
        else:
            return (L[len(L)//2 - 1] + L[len(L)//2])/2.0
    
    m = median([slope(i,j) for i in range(N) for j in range(i)])
    
    def error(i):
        x,y = samples[i]
        return y - m*x
    
    b = median([error(i) for i in range(N)])
    
    return m,b

m,b = 1,0
c.stroke(path.line(0,b,N,N*m+b),[color.rgb.green])

m,b = theilsen(samples)
c.stroke(path.line(0,b,N,N*m+b),[color.rgb.black])

def slr(samples):
    N = len(samples)
    sumxy = sum([x*y for x,y in samples])
    sumx = sum([x for x,y in samples])
    sumy = sum([y for x,y in samples])
    sumxx = sum([x*x for x,y in samples])
    m = (sumxy - sumx*sumy/N)/(sumxx - sumx**2/N)
    b = sumy/N - m*sumx/N
    return m,b

m,b = slr(samples)
c.stroke(path.line(0,b,N,N*m+b),[color.rgb.blue])

c.writePDFfile("ThielSen")

Краткие подписи

Добавьте однострочное описание того, что собой представляет этот файл

Элементы, изображённые на этом файле

изображённый объект

David Eppstein английский

История файла

Нажмите на дату/время, чтобы посмотреть файл, который был загружен в тот момент.

Дата/времяМиниатюраРазмерыУчастникПримечание
текущий18:59, 3 ноября 2011Миниатюра для версии от 18:59, 3 ноября 20112936 × 3075 (37 КБ)David EppsteinDarker green, thicker lines
23:40, 3 июля 2011Миниатюра для версии от 23:40, 3 июля 20112936 × 3075 (37 КБ)David Eppstein{{Information |Description ={{en|1=The en:Theil–Sen estimator (black line) of a set of sample points, compared to the simple linear regression line (blue). The points were generated by adding a small amount of jitter to points on the green dashe

Следующие 2 страницы используют этот файл:

Глобальное использование файла

Данный файл используется в следующих вики: